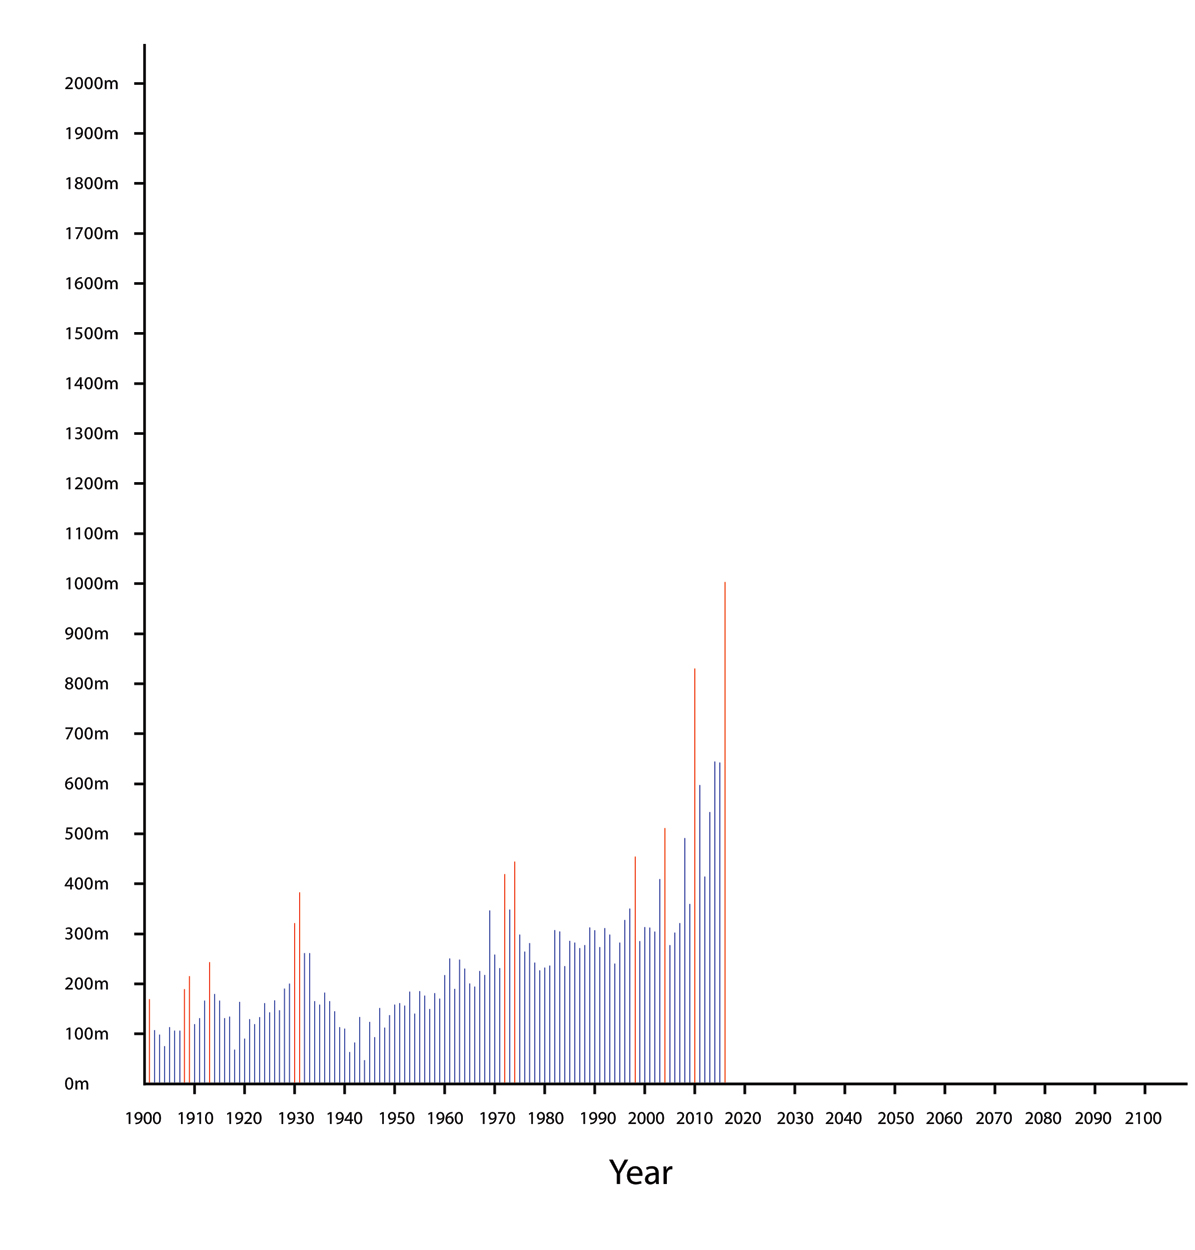
This is something I created today for my website. It took hours to draw. It shows the tallest completed buildings each year, from 1900 until the present day… plus some additional planned towers for 2011-2016.
Those marked in red are the ones which set a new record (e.g. Empire State Building, Sears, Petronas, Burj Dubai).
Anyway, I’m trying to extrapolate a trend from this data, to calculate the most likely heights for 2017-2100. It’s proving very difficult though. Does anybody know how I can do this? Is there some statistical method I could use to make it as accurate as possible? Should I include the record breakers in red, or do they bias the results by "inflating" the average height? Any help would be greatly appreciated… 🙂