Article Tags: Sea Level Gate
Plotting the global mean sea level (MSL) trends (from multi-satellite mission data) over almost 17 years from Oct 1992 – July 2009 shows a decrease in mean sea levels along most of the west coast of North & South America of approximately 50 mm or 5 cm during that period.
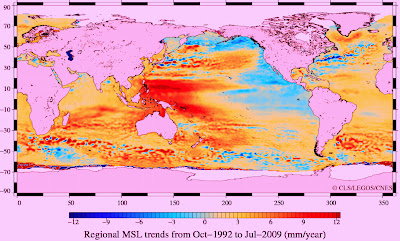
(Above graph was created by using photoshop neutral color picker on the original graph below from the satellite data browser to alter color scaling for clarity of positive and negative trends).
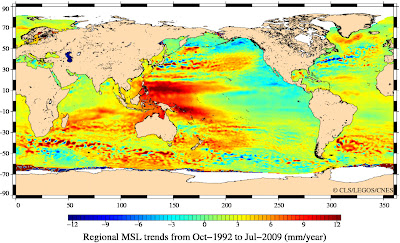
The plots show most of the sea level rise was concentrated in the equatorial Pacific region where periodic El Nino events raise ocean temperatures and regional sea level (large red area in graph). Small increases of 1 mm – 3.5 mm/yr are found at most other coastal regions during the period. Indeed, the AVISO site notes.
Click source to read more.
Source: hockeyschtick.blogspot.com