Author: Eddy Elfenbein

  • Let’s Be Honest, The GDP Report Was Terrible For This Point In The Cycle

    (This post originally appeared on the author’s blog.)

    The government reported that the economy grew by 3.2% for the first quarter. Normally, that’s not so bad but for coming out of a deep recession, it’s very unimpressive.

    Federal government spending, which includes remaining stimulus money, grew at an annualized rate of 1.4 percent in the first quarter of 2010. But this was more than offset by continued spending cuts from state and local governments, whose spending decreased 3.8 percent. It was the third quarter in a row in which state and local spending fell.

    “Government spending contracted, for all the ballyhoo about stimulus,” said John Ryding, chief economist at RDQ Economics. “This recovery is going to have to stand on the backs of private-sector demand, not on government demand, given all the current fiscal challenges.” Even though any pickup in business is welcome, modest improvement may not be enough to alleviate the pain caused by the so-called Great Recession, many economists say.

    The nation’s gross domestic product — a broad measure of goods and services produced in the country — is far below its potential, according to economists’ projections of where the economy would have been if it followed its long-term trend. Output would need to grow at least 5 percent annually for several years to get back on track — and perhaps more importantly, to lead to enough job creation to employ the 15 million Americans already out of work and the 100,000 new workers joining the labor force each month.

    Earlier this week, I took a stab at giving a letter name to this recovery. My guess for Q1 was pretty close but a tad too high (I had 3.5% instead of 3.2%). Here’s the up-to-date chart:

    GDP Grow Trend Apr30

    Thanks to several emailers, I’m going to call it an N-Shaped recovery.

    Here’s a more sobering way to look at GDP. This chart shows real GDP divided by a trendline growing at 3.08% which is about the long-term rate of growth.

    image936.png

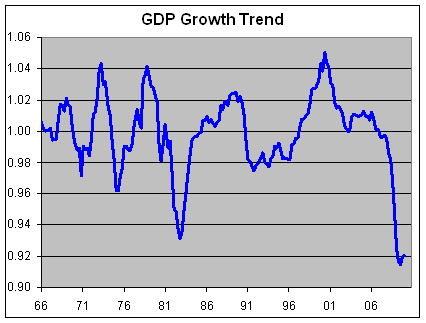
    In other words, this shows you how well GDP is doing compared with its historic growth rate. We’ve fallen off a cliff and are in the process of splatting.

    In previous recessions, the economy has snapped back sharply to its historic trendline (1.0 on the chart). By growing at 3.2% last quarter, the economy is barely making headway.

    At 0.92, we’re 8% below the trendline. This is what the NYT means by growing at 5% for a few years to get back on track. If the economy grew by 5% a year — 2% higher than the long-term trend — for four years, then we’d finally get back to something resembling normal.

    Join the conversation about this story »

  • Watch Out: The Cyclical Stocks Are Trading At An Extreme, And This Could Portend Trouble

    (This is a guest post from the Crossing Wall Street.)

    One of the quick-and-dirty metrics I like to look at is the Morgan Stanley Cyclical Index (^CYC) divided by the S&P 500 (^SPX). The Cyclical Index is composed on stocks that are closely tied to the economic cyclical. This means industries like autos, chemicals and mining.

    When we divided these two indexes, we can tell if cyclicals are outperforming or underperforming. The thing about cyclicals is that they, well, move in cycles. Check out the chart below:

    laskjnkasdn

    As you can see, there’s historically been a consistent up-and-down wave that averages a few years. This usually, but not always, corresponds with how well the economy is doing. Investors favor cyclicals during the good times, and flee them during the rough patches.

    I urge you not to place too much faith in this metric, but I want to show you that the market does, in fact, move in cycles. These are powerful and once the market is locked it, the cycle can last for some time. Therefore it’s important for us to understand where we are in a cycle.

    On top of that, the cycle has a double-whammy effect since the market generally does much better when cyclicals are outperforming, meaning they’re outperforming a market that’s already doing well (note the bottoms in 1982, 1990 and March 2009).

    You can really see how the last 18 months have dramatically impacted cyclicals. The ratio held up fairly well until September 17, 2009. Within six months, that ratio dropped from 0.7 to 0.42. The Cyclical Index dropped from 871 on September 19 to 283 by March 9. Youch, that’s a staggering loss so you can see that the non-cyclicals provided some shelter from the storm (though not as good as cash).

    But once the ratio hit bottom, cyclicals put on an explosive rally. Although the Cyclical Index is still well-below its high from 2007, the ratio has surpassed its high and has gone on to make several all-time highs. That’s about the shortest cycle I’ve ever seen. In fact, it was more like a panic mini-cycle. Last Thursday (pre-Fab), the ratio made its most recent all-time high of 0.786.

    Picking cycle peaks is a tricky business and I won’t attempt to do so now, but I’m on the lookout for a harsh drop off in the Cyclical Ratio. Once it gets going, it could down, down, down for a few years.

    Read more market commentary at CrossingWallStreet >

    Join the conversation about this story »

  • Is Goldman A Good Buy At 9x Earnings? Not A Chance (GS)

    MagnifyingGlass(This is a guest post from Crossing Wall Street.)

    In Tom Wolfe’s The Bonfire of the Vanities, the D.A. was known as Captain Ahab for his tireless search for the Great White Defendant. I can’t help but this of this when looking at the SEC’s case against Goldman Sachs (GS). This is a very convenient target coming at a very convenient time.

    If the facts we have are correct, then Goldman should clearly be found guilty before a moral court. However, the actual legal case the SEC has seems shockingly thin. Even after several months, the case will turn on the materiality of John Paulson’s role in forming the Abacus portfolio. Furthermore, Mr. Tourre isn’t merely a small fry—he’s a micro-guppy.

    The Wall Street Journal opines:

    After 18 months of investigation, the best the government can come up with is an allegation that Goldman misled some of the world’s most sophisticated investors about a single 2007 “synthetic” collateralized debt obligation (CDO)? Far from being the smoking gun of the financial crisis, this case looks more like a water pistol.

    My guess is that Goldman will end up writing a big check to make all this go away, say, about $200 million which would be around 40 cents a share for a company with a book value of $117. The damage to their reputation won’t be so easy to take care of.

    Let’s look at some numbers: Goldman is probably on track to earn about $10 billion this year, give or take, which works out to around $18 a share (in their Annus mirabilis of 2007, they made close to $25 a share). Owning Goldman is almost like owning your own ATM—the cash just flies out anytime you want.

    Using some mathematicification we can see that Goldman is going for around nine times earnings, and 1.4 times book value. Is that good buy? The stock is probably cheap but it’s definitely not a good buy. Looks can be deceiving. Sure, the SEC’s case may fall apart and Goldman will zoom back to $200 a share, but there are too many uncertainties to judge if that will happen. One of the most important keys to investing is to avoid any unnecessary risks. I don’t know what the SEC has up its sleeves. The agency is clearly under political pressure and they’ll do whatever they have to validate their existence. Buying Goldman now is a bet I’m not willing to take.

    Being a bank is all about trust. Ultimately, that’s the product you offer your clients. The specifics of the SEC’s case are surprisingly sloppy, but the picture is very stark. Goldman was not fully honest with their clients. This will probably lead to a string or more lawsuits. Until the dust clears, there are many better buys elsewhere.

    Read more market commentary at CrossingWallStreet >

    Join the conversation about this story »

  • The Authors Of Dow 36,000 Just Lost A Ten Year Old $1,000 Bet

    trader

    On Friday, January 14, 2000, the Dow closed at 11,722.98 — a level it wouldn’t break for over six years. That peak capped an amazing 17-1/2 year run. In the ensuring 10 years, we’ve lost about 1,000 points or roughly 8.9%. Inflation, or at least the CPI, has increased by about 28% which makes the inflation-adjusted close from ten years more like 15,000. Ten years ago, gold was going for about $280 an ounce (around $360 inflation adjusted).

    In the letters section of the January 2000 issue of the Atlantic, J. Douglas Van Sant of Stockton, California criticized the article in the September 1999 issue on Dow 36,000 by James Glassman and Kevin Hassett.

    Mr. Van Sant wrote:

    I would be willing to bet Glassman and Hassett that even ten years from now, when earnings and dividends should have nearly doubled, the Dow Jones Industrial Average will still be closer to its current level of 11,000 than to their hyperbolic projection of 36,000.

    Good call. The Dow closed yesterday at 10,680.77.

    Glassman and Hassett replied:

    To J. Douglas Van Sant we say, if the Dow is closer to 10,000 than to 36,000 ten years from now, we will each give $1,000 to the charity of your choice.

    I recommend Haiti.

    See more of Eddy’s great market commentary at Crossing Wall Street.

    Join the conversation about this story »

    See Also: