While I was testifying before the Senate Environmental Public Works Committee on the social cost of carbon last month, Howard Shelanski was testifying to the House Committee on Oversight and Government Reform on the exact same topic. As Shelanski was …
Author: Robert Murphy
-
MURPHY: Assessing the “Five Circles of Carbon Tax Hell”
The George C. Marshall Institute has released a new study from James DeLong outlining what it refers to as “the five circles of Carbon Tax Hell.” The study is very readable and concise (only 34 pages of main text), yet …
-
Using the CBO Report to Critique a US Carbon Tax
The advocates of a US federal carbon tax are in an awkward position. They have stressed to the public that the majority of natural scientists believe human-caused carbon emissions are at least partially responsible for the rise in global temperatures …
-
The Domestic Energy Bonanza and the Economy
A recent commentary on the Washington Post’s “Wonkblog” illustrates the ability of professional economics to collide with common sense. The article seeks to pooh-pooh the idea that America’s oil and natural gas expansion have contributed much to the (anemic) economic …
-
Earth Day and Capitalism
On Monday millions of people around the world celebrated Earth Day. Although there are always exceptions, it’s safe to say that the vast majority of these people are in favor of more government regulations to (allegedly) protect nature and the …
-
MURPHY: Ethanol Proponents Mislead on Gas Prices
In their recent op-ed on the ethanol mandate and gas prices, Tom Buis and Bob Dinneen greatly misled Politico’s readers with both contradictory claims and withholding crucial facts. Both the government’s own analysis and common sense tell us ethanol mandates …
-
White House Budget Taxes Producers, Subsidizes Inefficiency
The White House has released its FY 2014 Budget Proposal. It is a mix of massive tax hikes on the most productive segments of our economy, and a continuation of wasteful subsidies to sectors that fail the market test. …
-
The IMF’s Outlandish Claims About Energy Subsidies
Last week the IMF released a report that called on governments around the world to stop subsidizing energy. Initially we were shocked—as proponents of letting the market determine the allocation of resources, we at IER have opposed all energy subsidies …
-
Senator Whitehouse’s Duplicitous Carbon Tax Amendment
Last weekend the Senate rejected an amendment to the FY 2014 budget that would have enacted a carbon tax. For those interested in affordable energy and job creation, this was a good thing. Still, it’s worth walking through the actual …
-
Administration’s Half-Truths on Carbon Policy
In the latest Economic Report of the President, the Obama Administration devotes an entire chapter to its policies on climate change. As usual with such matters, the narrative begins with defensible statements about natural science, and then leaps to completely …
-
MURPHY: Brookings Study Misleads on Carbon Tax
An old joke says that if you laid all the world’s economists end to end, you wouldn’t reach a conclusion. We see that truth in the policy debates over a carbon tax. Just when NERA released its study documenting the …
-
Boxer-Sanders Carbon “Fee” Relies on Huge Bait-and-Switch
A recent story in EnergyGuardian (sub. req’d) centered on Senator Sheldon Whitehouse’s (D-R.I.) support for the carbon “fee” bill introduced by his colleagues Sen. Barbara Boxer and Sen. Bernie Sanders. Fortunately, the newly-released NERA study gives us a quantitative estimate of how much their scheme would hurt the U.S. economy. The whole episode fulfills the warnings that many of us have been making during the carbon tax debate. Specifically, advocates of a carbon tax rely on a bait-and-switch, where they make wild promises about the alleged environmental benefits of a relatively modest tax rate. As the NERA study shows, however, if the tax rate is modest, the environmental impact is negligible, but if the rate is high enough to really reduce U.S. carbon dioxide emissions, the economic impacts are absolutely devastating.
The Boxer-Sanders “Fee”: Bait-And-Switch
The specific legislation proposed by Boxer and Sanders describes itself in this way:
Price Carbon — While setting a long-term emissions reduction goal of 80 percent or more by 2050 as science calls for, the legislation would enact a carbon fee of $20 per ton of carbon or methane equivalent, rising at 5.6% a year over a ten-year period….The Congressional Budget Office estimates this step alone could raise $1.2 trillion in revenue over ten years and reduce greenhouse gas emissions approximately 20 percent from 2005 levels by 2025. Additional emissions reduction under this legislation would occur as a result of the energy investments, and ongoing efforts by the EPA and a number of states. [Bold added.]
Now the part I have put in bold is crucial, and it epitomizes exactly what I was saying in my post about the new NERA study. The proponents of a carbon tax (or “fee” as Boxers and Sanders are euphemistically calling it) want to have their cake and eat it too. On the one hand, they point to the “settled climate science” to show why a drastic and aggressive reduction in U.S. emissions is extremely important.
On the other hand, they know that most Americans would never support the policies necessary to actually achieve such aggressive reductions. Therefore, the proponents of a carbon tax do what Boxer and Sanders have done in the block quote above: They point to a relatively modest carbon tax level, which will only cause mild suffering for lower-income households and workers.
But since this level of the carbon tax won’t achieve the allegedly necessary emissions reductions, they then tell a magic-bullet story about using the proceeds of the carbon tax to fund all sorts of new technologies that will then render conventional energy production obsolete. That’s how they can sell the whole package to Americans as (a) achieving the drastic emission cuts by 2050 that they say are necessary, while (b) not imposing the carbon taxes upfront that the same models say are necessary to achieve part (a).
What Does NERA Say About an 80 Percent Reduction?
A new study by NERA Economic Consulting, prepared for the National Association of Manufacturers (NAM), perfectly describes the impacts on the US economy from the two “endpoints” of the Boxer/Sanders bait-and-switch. In other words, if the government really does stick to just a modest tax that rises gently over time, then the NERA study tells us the outcome. On the other hand, if the carbon tax gets its foot in the door, and then the hoped-for innovations in “clean energy” don’t materialize so that future policymakers jack up the carbon tax, then the NERA study shows how bad the economic hit would be in order to achieve an 80 percent emission reduction.
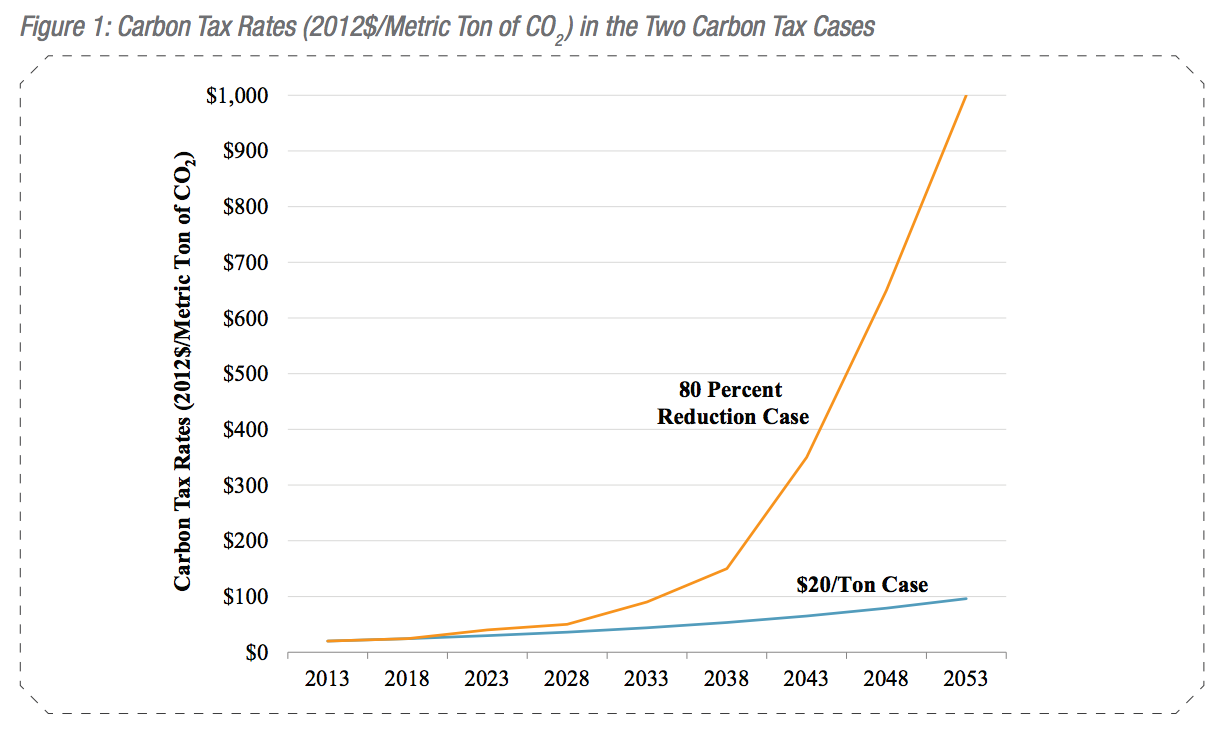
The following diagram from the NERA study shows the trajectory of the carbon tax over time, in the two scenarios:
In my earlier blog post, I walked through more of the NERA study’s details, but in this post let me just reiterate two of its most important tables. The first one below (Figure 3) shows the impact on workers from the two possible carbon tax scenarios:

Thus we see, for example, that the more aggressive carbon tax scenario implies a long-run average worker income loss of the equivalent of 1.26 million full-time jobs, while in year 2053 (when the carbon tax reaches its peak) the impact is a staggering hit to worker income of 20.67 million jobs. (In my earlier post I explain what the “job-equivalents” phrase means in this context.)
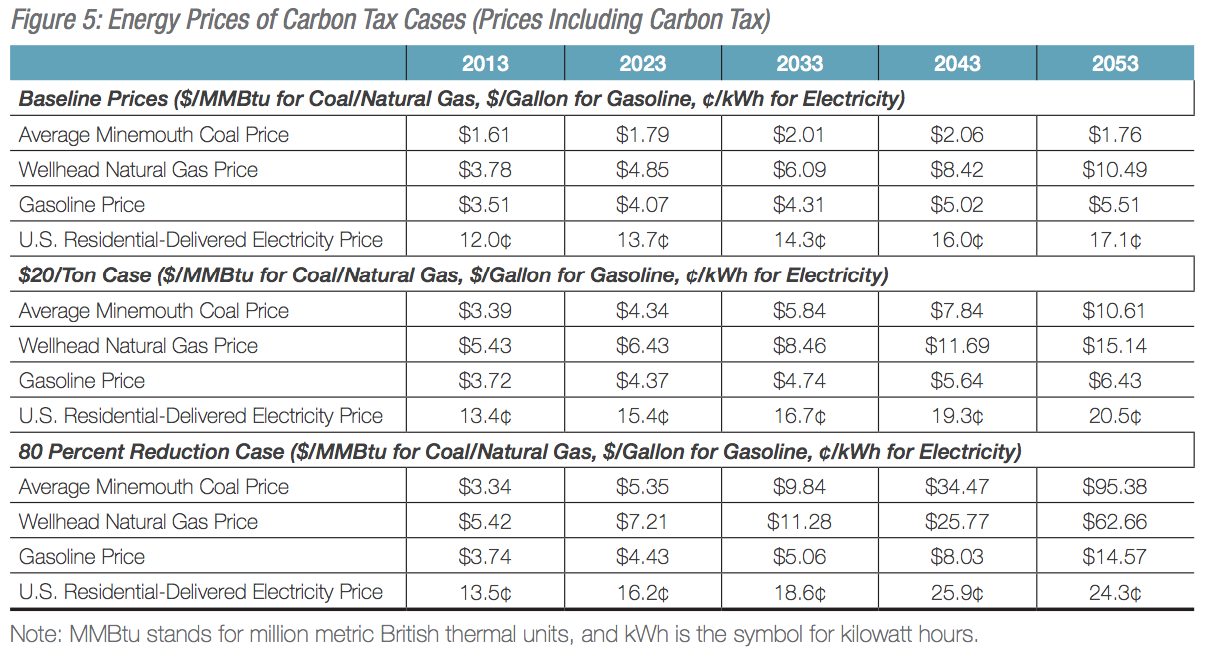
Finally, consider the effect of the two carbon tax scenarios on various energy prices:

In particular, the 80% reduction case shows drastic increases in electricity and gasoline prices in the coming decades, should the US government seriously try to meet the emission reduction targets that many groups are proposing as “sensible climate policy.” By 2053, the NERA study anticipates residential electricity prices having risen 42 percent relative to the baseline, and gasoline prices at a whopping $14.57 per gallon (compared with $5.51 in the no-tax baseline, because of rising crude market prices).
Note that this figure means there will be a tax of $9.06 cents per gallon, or $135 worth of tax for a 15-gallon fill up. Even if automakers can meet the new federal regulations that double fuel efficiency, the one-two punch of the economic dislocation of higher energy prices on businesses and families and the fact that such prices will price many out of personal transportation means there will be a huge number of feet pounding the pavement. (If there still is pavement, since asphalt is carbon based and cement uses enormous amounts of energy.) I can guarantee they will not be happy feet.
Conclusion
There are all sorts of proposals floating around on how many goodies the government could get, by taxing carbon. Recall the McDermott proposal from last summer, which would cause trillions of dollars of economic damage, over and above the theoretical benefits from reduced climate change, even according to the conventional models devised by people who support a carbon tax.
With the Boxer-Sander proposal, things are much more clever. First, they call it a “fee” because nobody likes the t-word. Secondly, they propose a relatively modest carbon tax rate, so that official analyses will show only modest energy price hikes and lost income. They assume that this modest nudge in the right direction will then kick off a wave of innovation in “clean energy” developments, because otherwise the US won’t come anywhere near the emissions reductions their own models say are absolutely critical.
Policymakers and the general public need to know all of the facts before making an informed decision on these weighty matters. When someone says the US needs 80 percent emissions reductions by 2050, and then touts a new “carbon fee” that will, according to their numbers, only achieve reduction of 20 percent in emissions by 2025, we should all be suspicious.
Proponents of a carbon tax should be straightforward with their presentation. If their plan is to tax the US into compliance with their emissions goals, then they should explain what their own models say will be necessary. (President Obama admitted as much in 2008.) Since they realize that the American public will never support such high tax rates, they should think of a different strategy, rather than using a bait-and-switch that won’t work, even on their own terms.
-
New NERA Study Shows Economic Dangers of a Carbon Tax
A new study by NERA Economic Consulting, prepared for the National Association of Manufacturers (NAM), documents the economic dangers of a federal carbon tax. The study is very conservative in its assumptions (as I’ll explain below), giving the benefit of the doubt to the proponents of a carbon tax. Even so, there study reaches two conclusions: Either the US government sets a carbon tax low enough so that its economic impacts are simply bad, but not awful, in which case there are few environmental benefits, or the US government sets a carbon tax aggressive enough to meet the emission goals that its proponents want, in which case it is economically devastating.
Either way, the average American household should be alarmed at the prospects of a U.S. carbon tax—and these numbers, to repeat, are very conservative in their estimates of its economic harms. Before implementing a carbon tax, policymakers should be very clear about what its objectives are. Up till now, proponents keep promising the moon: Extra revenues for tax cuts, deficit reduction, and “clean energy” investment, all while saving the earth from climate change! But the new NERA study shows that this is an illusion. By focusing on one or two of these goals, the carbon tax forfeits the others, and in no case does it pass any reasonable cost/benefit test.
The NERA Study’s Two Carbon Tax Scenarios
The NERA study looks at two scenarios for assessing the economic impacts of a carbon tax imposed at the federal level in the United States. In the first scenario, it assumes a $20 initial tax levied on each metric ton of carbon dioxide (CO2) in the year 2013, which then increases in inflation-adjusted terms by 4% each year. This scenario lines up with some recent projections conducted by the Congressional Research Service and the Brookings Institution, so it’s a good ballpark of a “modest” carbon tax proposal. Notice that in this scenario, there is a gentle uptick in the carbon tax over time, with little attention being placed on emissions.
The second scenario looks at the carbon tax trajectory that would be necessary to reduce US emissions by 80% relative to 2005 levels, by the year 2053. In other words, the second NERA scenario asks what the carbon tax rates would need to be over the next forty years, in order to achieve an 80% cut in US emissions by the end of the four-decade phase-in period. They picked this specific goal because it too is a popular discussion point, and is often used in discussions of international agreements on climate change policy. The only constraint on the carbon tax rate is a cap placed at $1,000 per metric ton.
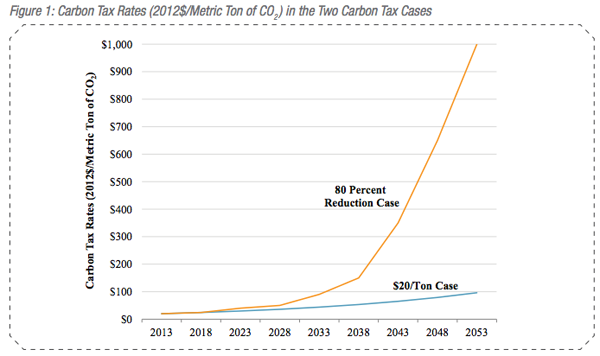
The following diagram from the NERA study shows the trajectory of the carbon tax over time, in the two scenarios:
At this point, we should pause and reflect on Figure 1 above. Proponents of a carbon tax like to argue that it will have a “modest” or “negligible” impact on US households, especially in the early years. If they want to argue this way, then they must have in mind the type of carbon tax schedule depicted in the first scenario (the blue line above).
But although the Scenario One approach will raise a lot of money for the government—and will thereby make American households that much poorer in terms of their personal finances—it is nowhere near what the carbon tax “needs” to be, in order to stave off the alleged environmental problems of unrestricted U.S. carbon emissions. The red line above shows the level necessary (in the NERA model) to achieve what the climate alarmists tell us is the barest minimum in cutbacks, to avoid catastrophe.
Thus we see, even at this stage, the rhetorical corner into which the carbon tax proponents have painted themselves. In order to drum up support from citizens for something that will obviously raise gasoline and electricity prices, as well as just about every other price, the carbon tax proponents stress the scientific research on climate change. But then when trying to pooh pooh the negative economic effects of their proposed “solution,” the proponents will talk about a very modest carbon tax that will barely put a dent in the alleged climate problem.
These observations thus far don’t prove whether a carbon tax is a good or a bad idea, but already we see that Americans have not been getting the full story in the standard discussions.
Economic Effects of the Carbon Tax
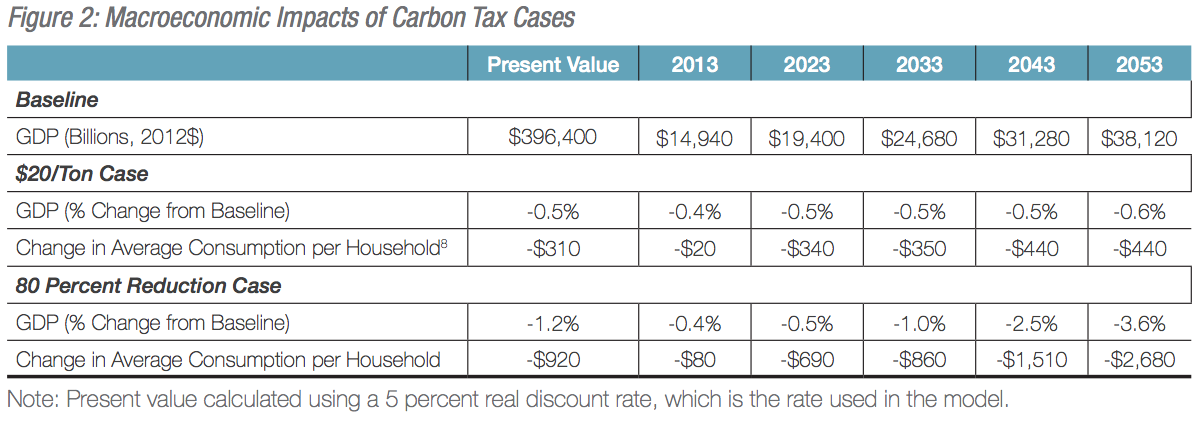
After explaining their two cases, the NERA study summarizes its findings in the following table, where the changes are measured relative to a no-carbon-tax baseline:
Let’s walk through the table above to be sure we understand it. The top line shows the baseline (no carbon tax) forecast of US GDP, in billions of inflation-adjusted dollars. For example, in the year 2033 the NERA study assumes baseline GDP would be $24.68 trillion.
As you move down the table, we see the impact of first the $20 Tax Case, and then the 80% Emission Reduction Tax Case. Since the latter is so much more punitive, it has bigger impacts.
Yet in both cases, we see that the annual impact rises drastically as we move forward in time. For example, the $20 tax case shows only a very modest $20 change in average household consumption in the first year, but this annual impact rises to $350 per household by the year 2033 (i.e. 20 years into the policy). Remember that the NERA study assumes—as do other studies and proposals—that the initially modest $20/metric ton CO2 tax rises steadily over time, which is why the damages increase over time.
In contrast, the 80% Reduction case shows a far more devastating impact. By the final year of implementation (2053), when the carbon tax has hit the ceiling of $1,000 per metric ton, the annual impact on the average household will be a reduction of $2,680—in that year alone. Overall US GDP will be a full 3.6% below what it otherwise would have been, in the absence of a carbon tax.
This is an incredible hit to economic growth. Consider that since the official “recovery” began, there have only been two quarters where US real GDP has grown at more than a 3.6% rate. Thus, NERA’s projected impacts in the second scenario eventually have the carbon tax lopping off more than an entire year’s worth of what would otherwise be considered great economic growth.
Because the impacts ramp up over time, the way to summarize in a “snapshot” the full long-term effects is to compute the “present discounted value.” This involves summing up near-term and long-term outcomes, but discounting future values at a 5% annualized rate. (It’s the same procedure used to calculate the current market value of a bond offering a stream of payments over the years, for example.) With this approach, the NERA study summarizes the $20 Tax Scenario as reducing average household consumption by $310 per year, while the 80% Emission Reduction scenario involves a near-tripling of the damages to $920 per household in an “average” year under the tax.
In a similar vein, the NERA study forecasts the carbon tax scenarios on the labor market:
Thus we see, for example, that the more aggressive carbon tax scenario implies a long-run average worker income loss of the equivalent of 1.26 million full-time jobs, while in year 2053 (when the carbon tax reaches its peak) the impact is a staggering hit to worker income of 20.67 million jobs.
It is careful to note that the carbon tax will not permanently “destroy jobs” in the sense that these people will be unable to find work. So long as the government doesn’t tinker with price controls (as President Obama wants to do with low-skill workers with his minimum wage proposals), then after the dust settles from a new carbon tax, workers can find niches in the economy. But the point is, the carbon tax imposes artificial constraints and makes workers less productive. Therefore, even though they can eventually find jobs, they will earn a lower wage or salary than they would have, in the baseline (no carbon tax) case. The “job equivalent” numbers in the table above are quantifying this reduction in total labor income, in terms of how much a full-time worker earns.
Finally, consider the effect of the two carbon tax scenarios on various energy prices:
In particular, the 80% reduction case shows drastic increases in electricity and gasoline prices in the coming decades, should the US government seriously try to meet the emission reduction targets that many groups are proposing as “sensible climate policy.” By 2053, the NERA study anticipates residential electricity prices having risen 42 percent relative to the baseline, and gasoline pries at a whopping $14.57 per gallon (compared with $5.51 in the no-tax baseline, because of rising crude market prices).
And of course, if someone is interested in the coal industry—forget about it. The price of coal in the high-tax scenario eventually ends up being 54 times higher than it would be without the carbon tax. Such a punitive tax rate will obviously destroy the coal industry, which after all is one of the stated objectives for those who want to drastically reduce US emissions.
The NERA Study Is Very Conservative In Its Projections
The NERA study is very precise and clearly lays out its assumptions; its authors are good economists. However, I would argue that its results are too conservative in their projections of the harms of a carbon tax.
The most obvious reason is that the NERA study assumes the carbon tax receipts will be used to either (a) reduce the federal deficit from what it otherwise would have been, holding spending constant and/or (b) reduce other taxes. In terms of supply-side economic analysis, given that there is going to be a new carbon tax, then the very best things one could do with the revenues is use them to cut other tax rates and/or to make the deficit smaller, so that the government doesn’t siphon off as much from the capital markets away from private investment.
In other words, NERA’s projections of economic outcomes under the two carbon tax scenarios has the government behaving very responsibly, doing just what a free-market economist would want, given that it was imposing a carbon tax.
In reality, of course, the government won’t keep its spending trajectory the same, (for reasons I explain here) in the presence of hundreds of billions of new annual revenue in the modest scenario, and even trillions of dollars in new revenue in the aggressive case. Specifically, the NERA projections show that the 80% Emission Reduction scenario has the federal government taking in $1.8 trillion in inflation-adjusted revenues by the year 2053 from its carbon tax.
Does anybody seriously believe this flood of new revenue won’t lead to higher federal spending than would otherwise be the case? Note that such spending would include any “transition payments” to help poorer households or certain industries adjust to the new carbon tax, which will surely be part of any politically feasible deal.
Conclusion
The new NERA study is a precise work of solid economics that carefully spells out its assumptions and offers nuanced conclusions. It outlines two plausible carbon tax scenarios—one involving “modest” tax rates that won’t significantly alter U.S. carbon dioxide emissions, the other involving very large tax rates that will impose crippling impacts on economic growth, worker income, and energy prices. Yet as ominous as the NERA numbers are, they vastly understate the true economic damage from a carbon tax, because they assume the government will use trillions of dollars (over the years) in new revenue in the most efficient manner possible, which is hardly a plausible assumption.
-
CFR Wants to Tax Oil Because Right Now It’s Too Expensive
The Council on Foreign Relations (CFR) recently released a study by Daniel Ahn and Michael Levi showing how a new tax on oil—which would ultimately raise pump prices by $1.20/gallon—might benefit Americans. The two main reasons were: (a) right now oil is too expensive, so taxing it would help, and (b) The revenue from a new oil tax would allow the government to spend more money, thus making the economy stronger. If the reader has not yet fallen out of his or her chair, in the rest of this blog post I’ll show that I’m not making this up.
CFR: We Need to Tax Oil Because It’s Overpriced
To establish the first claim, I can just quote from the introduction of the article itself, which says: “Economists have long argued that taxing oil consumption would be the most efficient way to address U.S. vulnerability to overpriced and unreliable oil supplies.”
It’s hard to even say much in response to this type of claim. If the problem with oil is that it’s “overpriced,” how in the world is it “efficient” to deal with that by slapping a tax on it?
As far as the “unreliability” of oil from overseas, again, it is unclear how Americans are helped by making oil more expensive. After all, if OPEC decided to cut off oil exports, the way that would manifest itself to American consumers would be a sharp rise in the price of gasoline at the pump. So to avoid this awful possibility, the CFR study proposes to…tax oil and raise prices at the pump.
A much more sensible and “efficient” solution to the problem of potential disruptions in oil imports from foreign regimes, is not to make oil artificially more expensive with a US-based taxed, but to remove US government obstacles to the development of North American supplies.
CFR: An Oil Tax Would Do the Most Good If It Were Used to Boost Government Spending
As if the introductory sentence weren’t bad enough, the meat of the article looks at various scenarios for the use of a tax on oil equal to 1.5% of GDP. Here are the three different ways that new revenue could be used, as analyzed in the study:
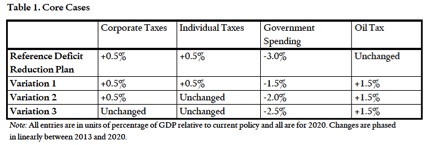
So in the baseline reference case, the study assumes that corporate taxes will rise by 0.5% of GDP, individual income taxes will do the same, while the government will cut its spending by 3% of GDP, for a total deficit reduction of 4% of GDP. Against this baseline case, the CFR study assumes there will be a new tax on oil, of 1.5% of GDP, which will (eventually) lead to $50/barrel tax, working out to $1.20/gallon price hikes at the pump if the tax were simply passed on.
How to use the new oil tax revenue? The CFR study looks at Variation 1, which devotes all of the new revenue to restoring half of the planned cuts in government spending. In other words, relative to the baseline case, Variation has the government impose a net tax increase on oil, so that the government can spend more.
In Variations 2 and 3, the new oil tax revenue is used to partially offset other planned tax hikes (i.e. meaning a tax cut, relative to the baseline), absorbing some of the oil revenue and leaving less for government spending.
The following figures show how the study models the impact of these variations on the economy:
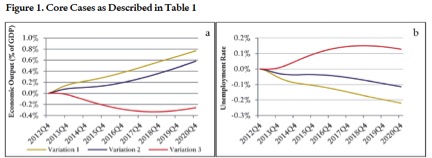
The above figures are quite instructive to see whether we should trust whatever model the CFR study used to generate their conclusions. Notice that Variation 1 leads (in the left graph) to a consistently growing economy, relative to the baseline case, and (on the right graph) to a consistently declining unemployment rate.
Step back and think about what that means. The CFR study is saying that if the government slapped a $50/barrel tax on oil, which works out to $1.20 per gallon of gasoline, and if it then used all of the revenue to increase government spending, then this would help the economy over an 8-year-period.
One might ask, almost in jest, “Well if a new oil tax of 1.5% of GDP is a good idea, why not make it bigger?”
Fortunately, the CFR study does just that. In the next section, they “demonstrate” that doubling the oil tax to 3% of GDP—i.e. $100/barrel of crude, or $2.40/gallon—and using all of the revenue to fuel government spending, would make the economy grow even faster, and create more jobs, than the Variation 1 from above.
Again, there’s not too much to say in response to this analysis, except that it is self-evidently absurd. Taxing energy to fuel increases in government spending is a terrible idea, if one wants to boost economic output and lower the unemployment rate. To achieve those goals, opening up federal lands to development would be much more sensible.
Conclusion
The irony is that there is nothing special about oil in the CFR study’s analysis. They don’t make an argument about climate change or other negative externalities, even though that was the context of the discussion. The actual mechanics of the underlying economic model are not spelled out, but it appears that the “results” are simply due to the alleged benefits of maintaining government spending. It is not clear why the same “results” couldn’t be generated by a 1.5% of GDP tax on coal, milk, or Slim Jims. It seems the crucial thing in the CFR study is that government spending be maintained, in order to keep the economy humming.
For people who don’t think government spending is the source of economic strength, a better policy would be to unleash entrepreneurs to develop domestic energy resources. This would reduce energy prices and make the supplies more reliable, thus mitigating the alleged problem with oil consumption. In addition, it would allow for more revenue for the federal (and other) governments, allowing them to reduce the deficit without raising other taxes.
-
Energy Affordability: Short- and Long- Term Trends
Energy is a crucial ingredient in every aspect of our lives, whether at home, school, or work. Fortunately, over the long-term, energy has become more affordable for Americans, measured in various ways. This is not a surprise, as human ingenuity and (relatively) free markets allow entrepreneurs to multiply the gifts of nature, even for so-called “depletable” resources.
However, in recent years energy has become less affordable. This too is not surprising, as the federal government has impeded the ability of firms to develop domestic energy resources, and as the Federal Reserve has weakened the dollar. If policymakers wish to raise U.S. (and world) living standards, they should move back in the direction of stable monetary policy and unfettered capitalism. The natural forces of innovation in a market economy will lead to more abundant supplies, in the economically relevant sense.
Long-Term Trend: Energy Becomes More Affordable
Viewed over the course of decades, energy has become much more affordable for Americans. In their book It’s Getting Better All the Time, Stephen Moore and Julian Simon document various measures of this fact. For example, they cite William Nordhaus’ calculation that the price of lighting has fallen significantly since the electrification of the nation began in the early 1900s. Originally, the price of 10,000 lumens was about $4, whereas by the end of the 20th century it had fallen some 99.5 percent, down to less than a penny. For another example related to lighting: In 1938, the average fluorescent light bulb lasted 1,500 hours, whereas by 2000 it lasted 100,000 hours.
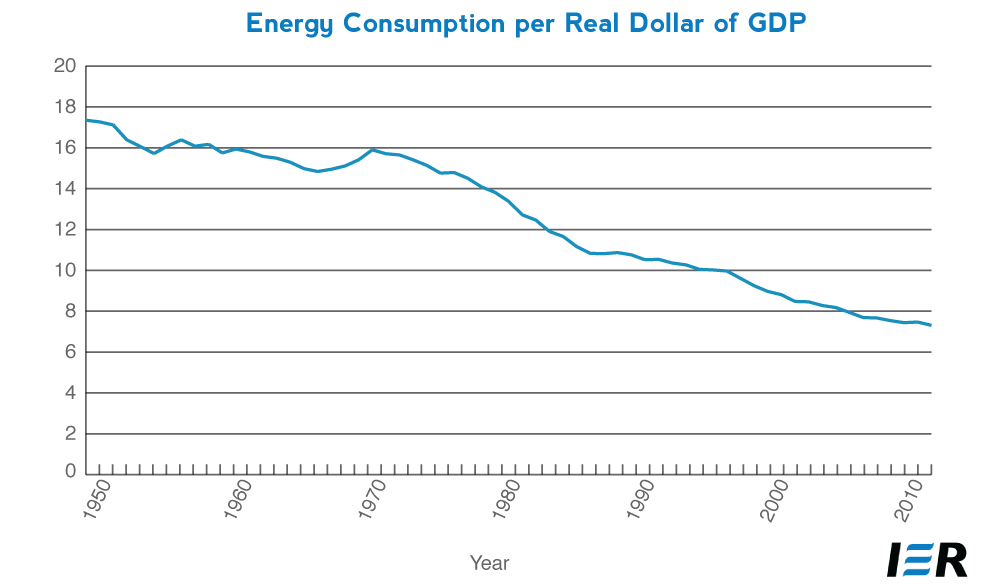
Over long stretches of time, the U.S. economy has become steadily more efficient in its use of energy, as measured by physical units of energy expended per dollar of real output. From 1949 to 2011, for example, the amount of gross output (in inflation-adjusted dollars) per unit of energy (in BTUs) almost doubled.[1]
Another way of seeing the long-term trend is to look at energy prices compared to average wage rates. This indirectly shows how much time a worker needs to spend, in order to make enough to buy a given amount of energy. The chart below shows the astounding improvement:
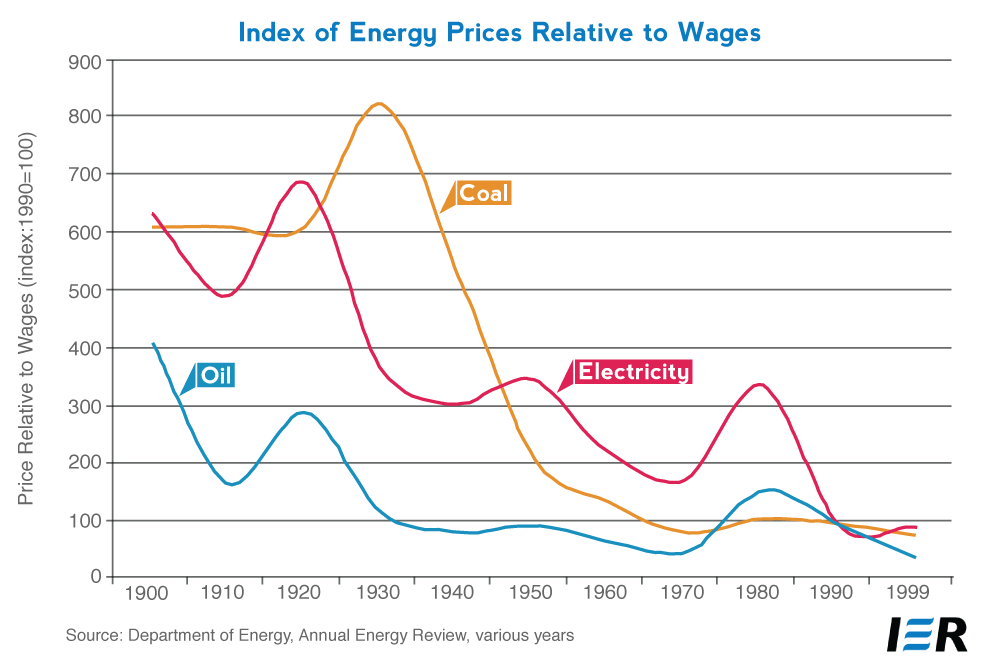
Adopted from “It’s Getting Better All the Time”
What is truly shocking—at least to those who don’t appreciate the wonders of entrepreneurship in a market economy—is that the economically relevant “supply” of so-called depletable resources has risen over the decades, too.
To take just one example: We can define how many “years worth of oil” the United States has, by taking the known oil reserves and dividing by current rates of oil consumption. Since there is only a fixed amount of oil on planet Earth, and since the rate of oil consumption has steadily risen since the Industrial Revolution, one would initially suppose that the “number of years left” would constantly shrink.
And yet, the opposite is true. In fact, the window of oil availability generally improved over the 20th century. At the end of 1944, “proved reserves” of crude oil were 51 billion barrels worldwide. By 2003, the number had grown to 1.27 trillion barrels of proved reserves. Given the annual rates of consumption in the two years, the world went from a proven supply of under 25 years’ worth of oil in 1944 to a supply of about 44 years in 2003.[2]
For a more modern illustration, consider: In 1944, the U.S. had oil reserves of 20 billion barrels. And yet, from 1949 through 2010, the U.S. produced 167 billion barrels of oil from domestic sources. That means the U.S. produced more than 700 percent of its reserves, starting from 1949. Obviously there is something fishy going on here.
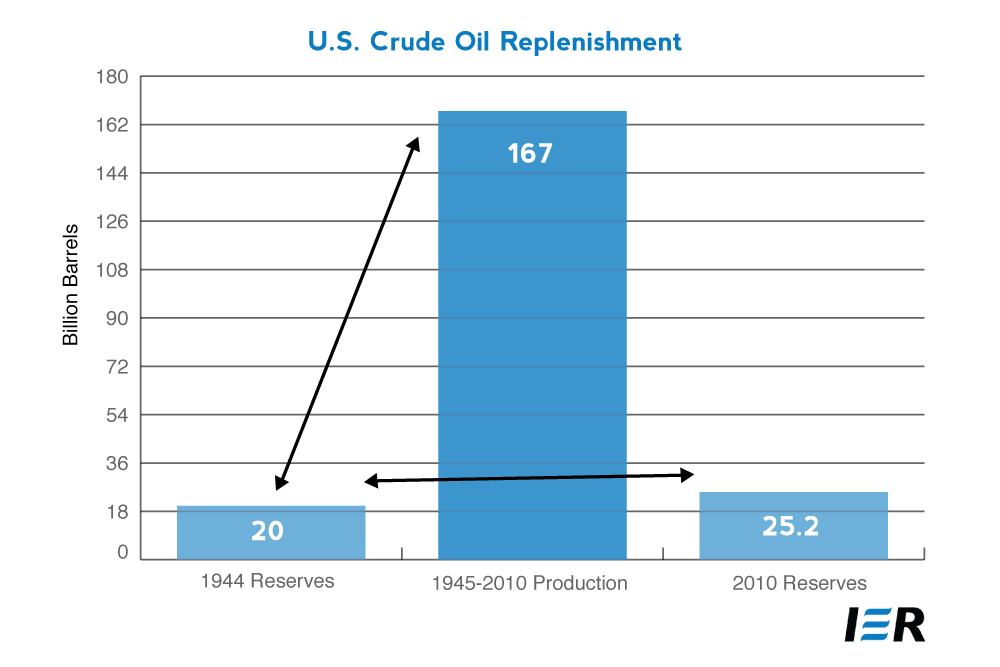 The explanation for this counterintuitive result is that, even though in a physical sense oil is a finite resource, in an economically relevant sense the amount of oil available for human use can expand, when prices rise. This is because the rising price gives a signal for entrepreneurs to go find more oil. As the above statistic illustrates, the process can work so well that humans actually become more energy-abundant over time, even with a depletable resource.
The energy doomsayers—who are constantly urging forced conservation and other restrictions on living standards—miss this mechanism. They are analogous to a child who checks the pantry for three days in a row, then announces to his parents that they have to start making sandwiches with only one slice of bread. The parents would explain, with a smile, that before “running out of bread” they would simply go to the store and buy more. It is similar with “oil reserves” and other such categories.
Indeed, currently there is enough natural gas in North America to power the U.S. (at current rates of consumption) for 175 years. There is enough “technically recoverable” coal to last for 500 years.
Clearly, the United States does not suffer from a scarcity of natural energy resources.
Energy Less Affordable in the Short Term
Unfortunately, although the long-term view is optimistic, over the last few years there have been disturbing trends in energy affordability, with the notable exception of the natural gas boom—which obviously is occurring despite government efforts to stymie it.
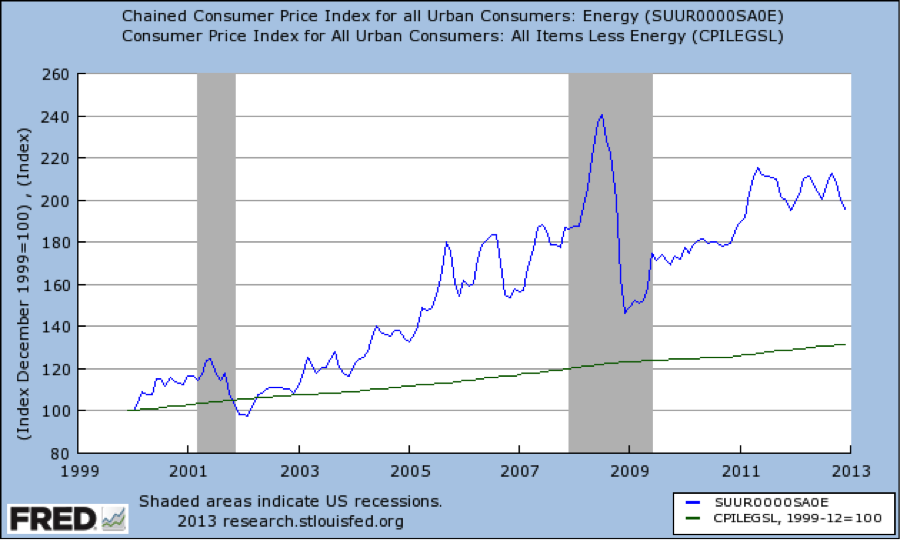
The above chart shows that since 2003, there has been a steadily increasing gap between energy prices, relative to other consumer prices. In other words, energy has gotten more expensive than the rest of the items measured in the Consumer Price Index (CPI).
There are of course numerous factors explaining relative price movements, but what we can say with confidence is that government restrictions on the development of domestic energy resources, makes energy more expensive than it would otherwise be.
We can also point to monetary policy as being instrumental in driving at least a portion of the run-up in prices. Many economists believe that in response to perceived “loose” Fed policies, the dollar falls and speculators rush to inflation havens, such as gold and silver but also commodities in general, including oil. Look at the connection between crude oil prices and the various rounds of “quantitative easing” by the Federal Reserve:
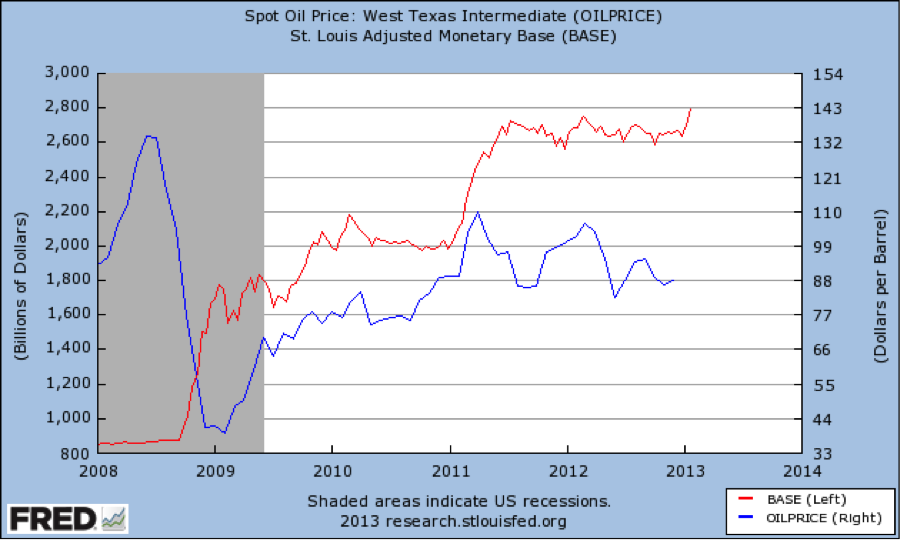
The fit is not perfect, of course—nothing ever is in macroeconomics—but since early 2009, the movements in oil prices closely follow the movements in the Fed’s balance sheet (approximated here by the “monetary base”), particularly during the two years from early 2009 to early 2011.
In fairness, one could defend Ben Bernanke by saying that with every round of “quantitative easing,” investors thought the world economy was on the road to future growth, and hence bid up the price of oil. Yet a cynic could equally well argue that the world economy is hardly in a robust recovery, despite literally unprecedented monetary inflation from the Fed and other central banks. A more plausible explanation of the chart above is that commodity prices are being bid up by the flood of liquidity crashing into an economy with very weak fundamentals because of misguided government policies.
Conclusion
Over the long term, energy in various forms has become ever more affordable. This is the natural outgrowth of (relatively) free-market capitalism. Even though certain resources are fixed in a physical sense, their “economic” quantity grows over time with innovation in uses and new discoveries.
However, during a shorter time frame, energy has become relatively more expensive for Americans. This can be partially attributed to government policies that restrict domestic development, and to Fed policies that encourage speculators to flee to inflation hedges such as commodities.
[1] Energy Information Administration, Annual Energy Review, Table 1.5, http://www.eia.gov/totalenergy/data/annual/pdf/sec1_13.pdf.
[2] See Robert Bradley and Richard Fulmer, Energy: The Master Resource, page 9 of Chapter 4, “Will We Run Out of Energy?”
-
National Climate Assessment Draft Embraces Non-Solutions
Last Friday the government released the draft of the third National Climate Assessment public comment. As so often happens in these episodes, the report is full of scientific diagnoses of a problem, and then jumps to a “solution” that won’t even work on the terms set forth by the report. If the worst-case scenarios are correct, then even very strong action by the federal, state, and local governments in the United States will do very little to alter the global climate, but will definitely cause great damage to the American economy, reducing the annual income of American family household by almost $2,000. Although the draft report’s wording would lead the reader to believe otherwise, even the “consensus” projections show that the U.S. will only contribute about 6 percent of the total global warming through 2100. This is an “inconvenient truth” that the proponents of intervention in the energy sector refuse to acknowledge.
The National Climate Assessment Wants Government to Act NOW
The full report is a whopping 147 Mb file, but an Executive Summary gives its flavor—and this is the only portion of the report that analysts and policymakers will read. The report doesn’t merely report on the natural sciences, but also gives a great deal of attention to government policy responses. Here’s a quote from the Executive Summary, where the numbers are the line numbers embedded in the draft:
“10 …Mitigation and adaptation are linked, in that effective mitigation reduces the need
11 for adaptation. Both are essential parts of a comprehensive response strategy. The threat of
12 irreversible impacts makes the timing of mitigation efforts particularly critical. This report
13 includes chapters on Mitigation, Adaptation, and Decision Support that offer an overview of the
14 kinds of options and activities being planned or implemented around the country as governments
15 at local, state, federal, and tribal levels, businesses, other organizations, and individuals begin to
16 respond to climate change (Ch. 26, 27, 28).
17 Large reductions in global emissions, similar to the lower emissions scenario (B1) analyzed in
18 this assessment, would be necessary to avoid some of the worst impacts and risks of climate
19 change. The targets called for in international agreements would require even larger reductions
20 than those outlined in scenario B1 (Figure 1). Meanwhile, global emissions are still rising, and
21 are on track to be even higher than the high emissions scenario (A2) analyzed in this report. The
22 current U.S. contribution to global emissions is about 20%. Voluntary efforts, the recent shift
23 from coal to natural gas for electricity generation, and governmental actions in city, state,
24 regional, and federal programs under way and have contributed to reducing U.S. emissions in
25 the last few years. Some of these actions are motivated by climate concerns, sometimes with
26 non-climate co-benefits, while others are motivated primarily by non-climate objectives. These
27 U.S. actions and others that might be undertaken in the future are described in the Mitigation
28 chapter of this report; at present they are not sufficient to reduce total U.S. emissions to a level
29 that would be consistent with scenario B1 or the targets in international agreements…”
We have underlined key elements of the excerpt above, which beautifully illustrate the tone of urgency and calls for drastic action by government at all levels. It is no wonder that the loudest climate alarmists welcome the draft with open arms, because it fits their messaging perfectly.
Unilateral U.S. Action Will Have Very Little Influence on Climate Change
There are well-known debates about the underlying physical science of manmade climate change. As an economist, I will put these issues to one side, and accept the standard results as reported in the International Panel on Climate Change (IPCC) at face value. Using the IPCC’s own projections, we can see that popular policy ideas such as a carbon tax would do very little to mitigate projected damages.
Recently climate scientist Chip Knappenberger walked through the IPCC emission scenarios and calculated how much of the total projected warming through the year 2100 would be due to US emissions from this point forward. His answer is shockingly low:
In other words, how much of the IPCC’s projected 1.1°C to 6.4°C of warming will the U.S. be responsible for in the next century? The answer is about 0.08°C of the low end estimate and about 0.35°C of the high end… Using the IPCC’s mid-range scenario, carbon dioxide emissions from the U.S. contribute about 0.19°C of the total 2.96°C global temperature rise.
Yep, that is it. For all the incessant talk as to how the highly consumptive U.S. lifestyle—from SUVs, to air conditioners, to big screen TVs and huge portion sizes—is leading climate catastrophe, the sum total of our contribution to “global warming” this century will amount to the neighborhood of about 0.2°C. Not five degrees. Not two degrees. But about two-tenths of a degree Celsius. And even this number may be on the high side if the climate sensitivity is lower than about 3°C (see here for more on recent findings concerning the climate sensitivity).
So all the U.S. carbon dioxide emissions restriction tactics—EPA regulations, cap and trade schemes, carbon taxes, efficiency programs, guilt-inducing ad campaigns, etc.—are aimed at chipping away at this already tiny 0.2°C. Big deal. [Emphasis in original.]
Thus we see that it was very misleading when the new National Climate Assessment draft said that the “current U.S. contribution to global emissions is about 20%.” In context, it led the reader to believe that the United States has the power to avert up to one-fifth of the potentially severe climate change the report says could be coming. Yet as Knappenberger’s analysis shows, this is wrong. China and India, with their growing economies, are projected to have much greater increases in emissions than the United States in the coming decades, meaning the U.S. share of the “blame” for future warming is more like 6 percent, not 20. Furthermore, even very aggressive U.S. government action wouldn’t eliminate all of this share, but the point is, even a total cessation of U.S. economic activity would at most avert 6 percent of the projected rise in global temperatures, according to the IPCC’s own mid-range scenario.
In this context, it’s worth pointing out that the draft report comes on the heels of the Doha round of discussions relating to the Kyoto Protocol, which even Kyoto’s host country, Japan, no longer supports. In fact, despite alarmist attempts to convince Americans of the errors of our energy ways, the number of countries agreeing to limit their own carbon dioxide emissions has shrunk dramatically, and now represents less than 15% of total world emissions.
US Policies Can Hurt Domestic Economy
But if the U.S., state, and local governments can’t do much to stop global warming, they can put a serious dent in economic growth. For example, the Heritage Foundation’s recent analysis quotes the government’s own assessment that a hypothetical $25/ton carbon tax would reduce the income of a family of four $1,900 in 2016, and cause large increases in gasoline and electricity prices.
The real irony is that a strong enough carbon tax to seriously reduce US emissions would spur increased emissions elsewhere, as industry relocated to jurisdictions that didn’t have penalties on emissions. The whole issue shows the futility of dealing with what the alarmists themselves recognize is a “global problem” with actions by individual governments. It is extremely unlikely that the poorer regions of the world will be content to remain in their current deficiency of energy development because of warnings about future climate change.
Conclusion
Even on its own terms, the newly released draft of the National Climate Assessment does not make the cost/benefit case for drastic U.S. government intervention in the name of mitigating future climate change. These policies would harm U.S. competitiveness while doing little to slow global emissions. To point out these facts isn’t to be a “climate denier,” it is simply to ask that policymakers base their decisions on sensible arguments.