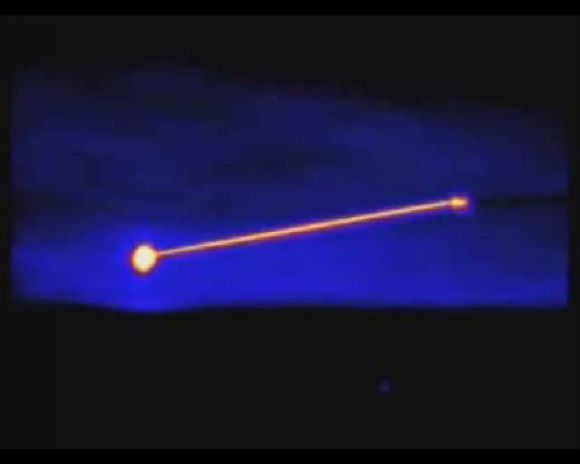
The February 11, 2010 test of the ALTB (the small, slightly horizontal blip on the right) against a target missile, the larger blip on the left. The target blip size is dominated by the exhaust plume.)
On February 11th, 2010, the Air Force successfully tested its Airborne Laser Test Bed (the new name for what was developed as the Airborne Laser or ABL). Since the ABL was how I got into this business, I feel a certain interest in its continued development. Others, especially Jan Stupl who is a Science Fellow at Stanford’s CISAC, have done a more complete analysis since I did my study (also as a CISAC Science Fellow ) on the ABL. Jan’s thesis at Hamburg University involved authenticating a finite element simulation of a laser heating up a rocket’s airframe by actually comparing it with experiments he did. I consider his study to represent the current state-of-the-art knowledge in the nongovernmental community. (While at CISAC, Jan has extended that study with a very important analysis of using lasers as anti-satellite weapons.)
I think my most important contribution to the ABL discussion was in presenting a way of thinking about laser missile defense engagements. This is summarized by this graph, which shows the two important curves for determining a laser’s effectiveness, which can be characterized by the length of time it takes the laser to heat up the rocket’s skin enough for internal stresses to break the missile apart. (See Jan Stupl’s work for more accurate time estimates.)
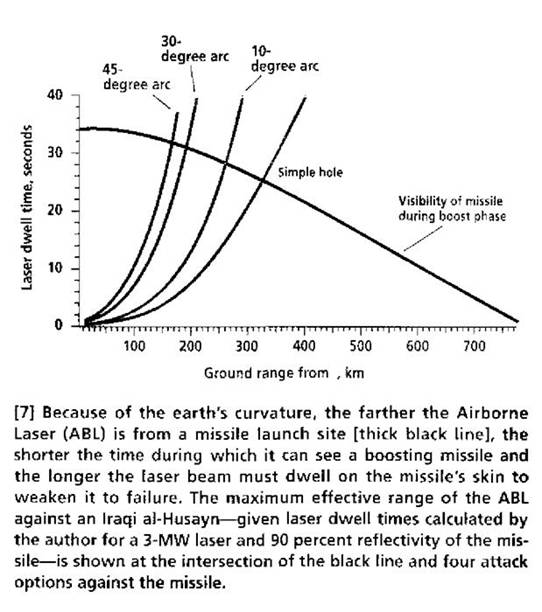
An example of how to think about laser engagements. It depends on the nature of the target missile as well as the laser’s energy; both of which are uncertain.
One graph, the “visibility” curve, shows how long the missile is visible to the ABL while it is under power. (The ABL’s kill mechanism requires that there be a large axial load on the airframe that is only there while under power.) As the ABL gets farther away, the Earth’s curve hides more and more of the powered flight either behind the Earth’s limb or, perhaps more likely, behind a large barrier of atmosphere that disrupts the laser beam. On the other hand, the farther away the laser is, the long it takes to deposit enough energy to cause a failure. That is represented by the graphs that are increasing dramatically with distance. The distance at which these two types of curves cross is the maximum range of ABL.
Videos of the February 11th test have been altered to mask the time of the actual engagement. (That is what they say at the start of each video segment.) My guess, based on how fast pieces seem to fall away, is that they have been sped up. Which, of course, makes the laser seem more effective. Another apparent feature of the videos is how close the target and the ALTB are. This has two effects. Most importantly, the engagement is much farther down the “time required” curves. But it also means a given change in the missile’s position, as it accelerates along its trajectory, will produce a bigger angular displacement as viewed from the ALTB. That should mean it is easier for the onboard targeting systems to follow the target. It also appears that the ALTB is pointing down when it fires. This could, of course, be an artifact of the position of the camera. However, if it is true, it means both that the laser is firing through more atmospheric turbulence (an impressive achievement) and that the rocket is moving slower than it would if it was allowed to gain altitude. The later means, of course, that it is easier to shoot down.