Carl Zimmer, among other readers, has pointed me to the latest outbreak of bio-political punditry. This time it isn’t David Brooks, but rather Nicholas Kristof, “Our Politics May Be All in Our Head“, 2/13/2010:
We all know that liberals and conservatives are far apart on health care. But in the way their brains work? Even in automatic reflexes, like blinking? Or the way their glands secrete moisture?
That’s the suggestion of some recent research. It hints that the roots of political judgments may lie partly in fundamental personality types and even in the hard-wiring of our brains.
Researchers have found, for example, that some humans are particularly alert to threats, particularly primed to feel vulnerable and perceive danger. Those people are more likely to be conservatives.
Kristof’s “recent research” link goes to Kevin Smith, Douglas Oxley, Matthew Hibbing, John Alford, and John Hibbing, “The Ick Factor: Disgust Sensitivity as a Predictor of Political Attitudes“. The abstract:
Mounting evidence suggests political attitudes connect to broad, dispositional, perhaps biological temperaments. We add to these empirical results by reporting a correlation between certain political attitudes and physiological reactions to disgusting stimuli such as human excrement and worms being eaten. Specifically, we find that individuals whose skin conductance levels increase when viewing disgusting images are more likely to adopt “conservative” positions on homosexuality and perhaps a broader range of “sex and reproduction” issues, a result that serves as a useful illustration of the larger point that political attitudes cannot be separated from generic physiological traits.
This is listed as a “Paper prepared for presentation at the annual meeting of the Midwest Political Science Association”, April 2008; but unfortunately, the copy available at the link given is almost impossible to read (because the type is so small, with no method that I could find to enlarge it), and I couldn’t find another copy on line. [Update — a helpful reader showed me how to get a .pdf, and so I’ll blog about Ickology as time permits.]
However, a similar set of ideas and experiments are presented in a more accessible way in Douglas Oxley, et al., “Political Attitudes Vary with Physiological Traits“, Science 321:5896, 9/19/2008:
Although political views have been thought to arise largely from individuals’ experiences, recent research suggests that they may have a biological basis. We present evidence that variations in political attitudes correlate with physiological traits. In a group of 46 adult participants with strong political beliefs, individuals with measurably lower physical sensitivities to sudden noises and threatening visual images were more likely to support foreign aid, liberal immigration policies, pacifism, and gun control, whereas individuals displaying measurably higher physiological reactions to those same stimuli were more likely to favor defense spending, capital punishment, patriotism, and the Iraq War. Thus, the degree to which individuals are physiologically responsive to threat appears to indicate the degree to which they advocate policies that protect the existing social structure from both external (outgroup) and internal (norm-violator) threats.
In other words, the Science paper deals with reactions to sudden noises and theatening visual images, correlated with political attitudes toward level of support for what the authors call “protective policies”. The nearly-unreadable conference paper makes an analogous argument about reactions to disgusting images correlated with political attitudes towards “sex and reproduction issues”, especially homosexuality. So I’m going to discuss the Science paper — if someone can point me to a readable copy of the “disgust” paper, I’ll be happy to apply the same analysis there.
(By the way, you can see from the quoted abstracts that Kristof’s account of this work is not very different from what the authors themselves have to say about it. This is not a case of egregious journalistic misunderstanding or over-interpretation.)
In the rest of this post, I’m going to go over some aspects of the analysis in the Science paper, and argue that the explanation offered is at least excessive and possibly wrong. I’m somewhat hampered in doing this by the fact that some relevant aspects of the authors’ data are not published, and also by (what I found to be) some ambiguities in the presentation of their data and their models. If as a result I’ve misunderstand what they did or how they interpreted it, I apologize in advance. I plan to write to the authors and ask for clarification and for a copy of their original data, which would allow me (and others) to make a more full and fair evaluation.
First, who were the subjects?
Subjects were recruited in May of 2007 by the Bureau of Sociological Research at the University of Nebraska-Lincoln (BOSR). BOSR contacted a random sample of residents of Lincoln, Nebraska. This initial telephone call followed an introductory letter and was used to pose a limited number of items to respondents with the intention of obtaining a group of individuals with strong political convictions toward whom intense and more focused investigation would be directed. The following three questions were used to screen potential subjects. Yes or no response categories were given for all three questions.
1. Do you follow politics or political issues closely?
2. Is there a certain political issue or set of political issues you feel strongly about?
3. Have you ever supported a particular political issue or cause?
A total of 1310 people were contacted and 608 of them completed the screening items. Subjects were recruited for this particular project only if they responded “yes” to all three questions. A total of 143 respondents did so and were agreeable in principle to coming to the lab. BOSR was able to schedule (and secure the attendance of) 48 individuals at both sessions (survey and physiological) of this project. Health problems rendered the data from one individual unusable and mechanical problems with a sensor spoiled the data from another, leaving a final total of 46 participants.
Their sample of 46 subjects included 29 males and 17 females; and the distribution of education levels was also rather skewed:

So how did Oxley et al. measure the subjects’ political attitudes about “protective policies”?
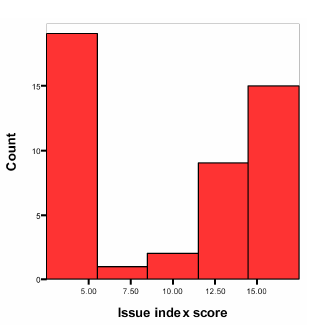
The dependent variable … is an additive index of 18 issue items based on a standard Wilson-Patterson battery. For each issue, respondents were asked to “please indicate whether you agree or disagree with the topic listed,” and were given “agree,” “disagree,” and “uncertain” response options. These options were coded as “1” when they indicated support for protective policies (e.g. for agreeing with the death penalty, or for disagreeing with pacifism), “0” when they indicated opposition to protective policies (e.g. for disagreeing with the Patriot act, or agreeing with pornography), and “.5” for an uncertain response.
As I understand it, they made no special efforts to create the bimodal distribution of summed opinion scores that resulted:
They then ran two psychophysiological tests on the same set of subjects. One was a measure of “skin conductance level” (SCL) recorded while
[e]ach participant was shown three separate threatening images (a very large spider on the face of a frightened person, a dazed individual with a bloody face, and an open wound with maggots in it) interspersed among a sequence of 33 images.
“Conductance” here is the inverse of resistance, measured in log μ-Siemens:
After logging the data to normalize the distribution, we computed the change in the mean level of skin conductance (SCL) from the previous interstimulus interval (10 s) to the stimulus of interest (20 s). This calculation isolates the change in skin conductance induced by the stimulus and reduces the effects of baseline variations across participants.
(Issues of units, normalization, and measurement intervals aside, this is basically the same phenomenona that goes under the older and somewhat more familiar name of “Galvanic Skin Response” or GSR, and is caused by changes in the autonomically-induced activity levels of sweat glands.)
The other physiological measure was the EMG associated with startle blinks, elicited in response to unexpected noise bursts, where “higher blink amplitudes … are indicative of a heightened ‘fear state’”.
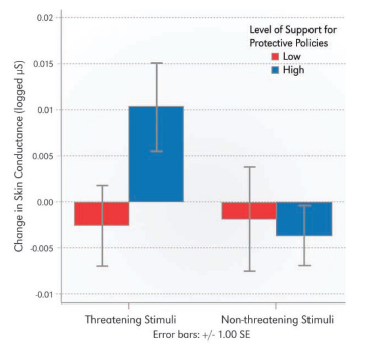
Here’s the authors’ graphical presentation of the basic result for the SCL measurements. They divided their 43 subjects into those who scored above the median on the “support for protective policies” questionnaire, and those who scored below the median. There was little difference between the groups in response to the non-threatening pictures, but a statistically-significant difference in response to the threatening pictures:
Nicholas Kristof describes the analogous results in the sex-disgust paper this way:
Liberals released only slightly more moisture in reaction to disgusting images than to photos of fruit. But conservatives’ glands went into overdrive.
“Overdrive” is a bit of a stretch, I think — for comparison, here’s a table from Rosalind Picard and Jennifer Healey, “Affective Wearables“, ISWC97, showing SCL changes for five subjects as a result of some simple activities such as standing up or coughing:
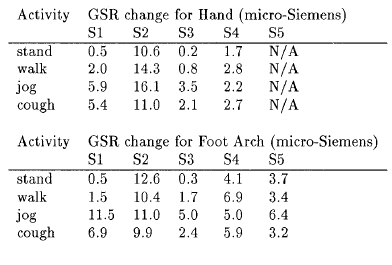
The difference in means between Oxley et al.’s “high” and “low” protective-policies groups is about .0125 log μS. Assuming that they used natural logs, this difference seems to be about two orders of magnitude less than the (unlogged) amounts that Picard and Healey measured as the effect of coughing — log(2.4) = 0.88; log(9.9) = 2.29. (This seems like such a preposterous difference that I wonder whether I’ve got something seriously wrong here — but in any case, I hereby register some skepticism about the “going into overdrive” description…)
Without making any cross-study assumptions, we can evaluate the effect size in Oxley et al.’s results. From the graph reproduced above, you can see that the difference between the mean (SCL response to threatening pictures) of the “high” and “low” protective-policies groups is about .0125 log μS, with a standard error of about .005 log μS. Given that there were 23 subjects in each category, this translates to a standard deviation of about .005*sqrt(23) ≅ .024 log μS, so that the effect size is about d = .0125/.024 ≅ 0.52.
Though statistically significant, this is only a moderate-sized effect — the associated overlap between the two distributions can be represented graphically this way (assuming normal distributions with equal variances):
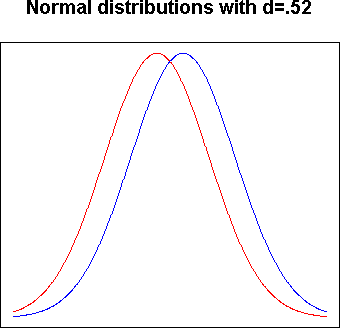
We can quantify this difference in intuitive terms by calculating how often a randomly-selected person from the “high support for protective policies” group would have a greater average skin-conductance change, on viewing threatening pictures, than a randomly-selected person from the “low support for protective policies” group would: about 64% of the time.
We can also compare another effect from the same study, namely amount of education. This factor is presumably a matter of “individuals’ experiences” rather than biology — but contrary to what (Kristof’s description of) this line of research might lead to you to think, its predictive effect in this experiments was as large as or larger than the effect of the “biological” variables.
As a result of fitting this regression equation

they derived the following coefficients:
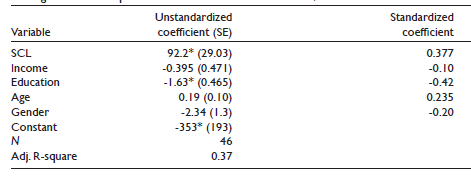
The coefficient of -1.63 for the six-level Education scale means that someone in the “College-Plus” categories was predicted to be 5*1.63 = 8.15 (out of 18) points lower on the “protective policies” scale than someone with a high school education (other things in the regression being equal).
What about the magnitude of the skin-conductance effect? Well, the coefficient is 92.2, which means that the more a subject’s SCL reacted to threatening images, the higher their “protective policies” attitude scale was. But recall that the average SCL measurement for the high-protective group was about 0.01, and the average SCL measurement for the low-protective group was around -0.0025 (these measures are log μ-Siemens, so a negative value just means that the conductance measurement was below 1). So the predicted average effect is around 0.01*92.2= 0.922 for the high-protective group, and -0.0025*92.2 = -0.2305 for the “low-protective” group, or an overall mean difference of about 1.15 (out of 18) between the groups attributable to the skin-conductance differences.
In the Supplementary Online Material, we learn the the overall standard deviation of their SCL data was 0.022 log μ-Siemens. So to equal the predicted effect of 8.15 political-attitude points between high-school and college-plus, we’d need an SCR difference of 8.15/(92.2*0.022) = 4.02 standard deviations.

We can draw a similar conclusion by comparing the standardized regression coefficients of 0.377 for SCL and -0.42 for education.
So the SCL “effect size” was modest, not only in the sense that the difference in means between two politically-defined groups was only about half of the within-group standard deviation, but also in the sense that it appears to have somewhat less predictive leverage than educational level does.
The same comparisons for eye-blink amplitudes lead to similar conclusions. The easiest way to see this is by comparing the standardized regression coefficients for Mean (eye-blink) amplitudes (0.286) and Education (-0.458):
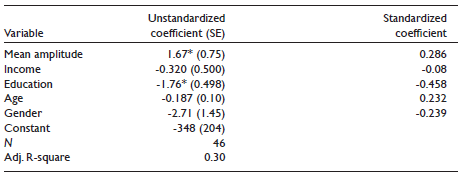
For this model, the predicted effect of the span from highschool to college-plus is 5*-1.76 = -8.8 political-attitude units, and (since the SOM gives the standard deviation of eye-blink amplitude as 0.93) we’d need 8.8/(0.93*1.67) = 5.7 standard deviations of change in eye-blink amplitude to have the same effect as the educational span.
All of this suggests that the “biological” factors of SCL and eye-blink amplitude are somewhat less potent, in this experiment, than the “social” factor of educational level. But it seems to me that in this case, the “biological” factors might turn out to be partly “social” factors after all.
Why? Well, it’s likely that political opinion in Lincoln divides to some extent along town-gown lines. It’s also plausible that town-gown uneasiness is not unknown in Lincoln, and that a non-academic with conservative opinions, coming into a University laboratory to get wired up with electrodes for a study of political opinions, might have a somewhat higher overall anxiety level than university faculty, students or staff would. This could be true independent of educational level — my own experience is that non-academic lawyers and doctors, for example, often seem a bit uneasy around academics. (And vice versa, but in this case it’s the academics who are wielding the electrodes.)
Furthermore, people who are more on edge, in an unfamiliar environment that they perceive as potentially hostile or at least potentially embarrassing, are likely to show greater autonomic reactions to negative stimuli. (In a crude analogy, suspenseful music and unsettling camera angles tend to make you jump higher when the cinematic equivalent of “threatening images” appear.)
An argument of this form suggests that (at least some fraction of) the (already modest) statistical effect of the physiological variables on political opinion might not reflect individual “dispositions” at all (whether innate or acquired), but rather might be the result of greater social distance (from the experimental setting) for a significant fraction of the people at one end of the political spectrum being tested.
Despite my skeptical comments, it seems to me that this work is interesting and worthwhile. It’s entirely plausible that political attitudes are associated with “dispositional temperaments”, and it’s also plausible that “dispositional temperaments” owe something to nature as well as nurture. But it seems to me that it’s exactly when theories are plausible that we should be most scrupulous in examining the evidence: as Dick Hamming used to say, “Beware of finding what you’re looking for”.