 I’ve been tinkering with this for a few months and decided today it’s ready to publish.
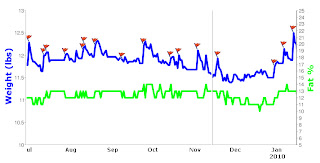
Click on the image, here, or on the link in the right sidebar to go to the chart.
The data is kept online in a Google spreadsheet and streamed directly into the chart image. So when I update online, the chart updates. There are also embedded notes and links to take you to related posts or Twitter entries.
Feedback welcome – does it work okay on your browser? Does the format make sense? Anything else you’d like it to do?